Another bird will always have the most similar DNA to any given bird, but if you're asking which non-bird organism comes closest, the answer is crocodilians (alligators and crocodiles). IQ is a human-specific cognitive test, so birds do not have an established “IQ” value the way people do what is the iq of a bird. Birds and crocodilians are the only two living groups of archosaurs, and their genomes reflect that shared ancestry more closely than any other living animals outside the class Aves. After crocodilians, turtles are the next closest, followed by other reptiles, and then mammals, which are considerably more distant despite being warm-blooded like birds.
Which Organism Has the Most Similar DNA to Birds?

Marcus Chen
14 May 2026
What "DNA most similar" really means
When biologists say two organisms have "similar DNA," they're measuring genetic relatedness, which is essentially a count of how many DNA base-pair differences have accumulated since two lineages last shared a common ancestor. The fewer differences, the more recently they split, and the more similar their genomes look. But "similar" needs a bit of unpacking because you can measure it several ways.
The most meaningful comparisons use orthologous genes, meaning genes that are direct evolutionary counterparts in two different species, descended from the same ancestral gene. Comparing orthologues is like comparing the same chapter in two editions of a book. Comparing non-orthologous genes (called paralogues) is like comparing different chapters, and you'll get a misleading result. Tools like Ensembl Compara and OrthoDB are built specifically to find and compare orthologues across species, which is why researchers use them instead of raw sequence searches.
You also have to decide whether you're comparing mitochondrial DNA (mtDNA) or nuclear DNA. Vertebrate mitochondrial DNA mutates roughly 25 times faster than nuclear DNA, so mtDNA-based comparisons can make two species look either much closer or much more different depending on how the timing works out.
A large mitochondrial DNA analysis reported strong support for a Cretaceous origin of modern avian lineages, even though it disagreed with some fossil-based timelines [strong mitochondrial DNA support for a Cretaceous origin of modern avian lineages](https://pubmed. ncbi. nlm. nih.
gov/18226223/). Nuclear, genome-scale comparisons are generally more reliable for establishing deep evolutionary relationships, and that's what large phylogenomic studies of birds have used, including a landmark 2014 analysis of 48 bird genomes and a 2024 Nature study using over 63,000 intergenic loci.
Closest relatives of birds in evolution (bird to bird comparisons)
The most similar DNA to any bird will come from another bird. Soil is important to a bird because it supports the insects, seeds, and other food sources many birds rely on The most similar DNA to any bird will come from another bird. . Within the class Aves, your closest genetic match is simply your nearest relative in the bird family tree.
A robin's DNA will be most similar to other thrushes, then other songbirds, then other perching birds, and so on outward through the orders. Large-scale genomic studies have now resolved most of the major branches of the bird tree, so you can look up where any species sits and predict which other birds will be its closest DNA matches.
The internal structure of bird evolutionary relationships is genuinely complex. Early diverging groups like ostriches and emus (palaeognaths) sit at one end of the tree, while the enormous superorder Neoaves contains almost all other living birds. Within Neoaves, rapid early diversification created a lot of short branches that were difficult to resolve until genome-scale data became available. The practical takeaway: if someone asks "which bird has DNA most similar to a chicken?" the answer is other landfowl like turkeys and pheasants, not pigeons or songbirds.
Non-bird amniote relatives: crocodilians and turtles
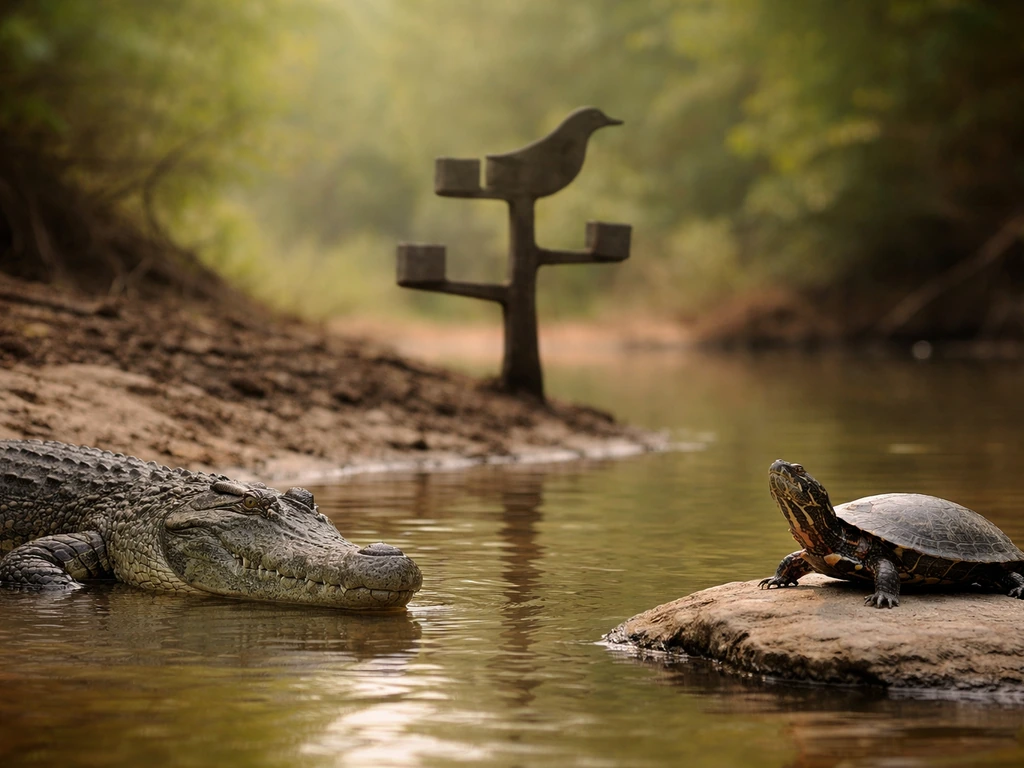
Outside of birds, crocodilians are the closest living relatives. Birds and crocodilians together form a group called Archosauria, and multiple large nuclear-gene studies confirm this. A phylogenomic analysis using 248 nuclear genes and over 187,000 nucleotide sites placed turtles as the sister group to the entire bird-plus-crocodilian clade. A phylogenomic analysis using 248 nuclear genes (187,026 nucleotide sites) concluded that genome-scale nuclear data supported turtles as sister to birds plus crocodiles (Archosauria) 248 nuclear genes and over 187,000 nucleotide sites. In plain terms: turtles are closer to birds than lizards or snakes are, but crocodilians are even closer.
This surprises a lot of people because crocodiles look ancient and reptilian while birds look nothing like them. But looks are misleading when it comes to DNA. Birds evolved from within the archosaur lineage, and their last common ancestor with crocodilians lived roughly 250 million years ago. That's more recent than the bird-turtle split, which is why crocodilian genomes show more shared sequence with birds than turtle genomes do, even though all three are reptiles in the broad sense.
The turtle position was actually debated for decades. Earlier mitochondrial DNA studies gave inconsistent results, sometimes placing turtles closer to crocodilians, sometimes to lizards. Nuclear genome data has largely settled the question: turtles are sister to Archosauria (birds and crocs together), making them the third-closest living group to birds after crocodilians.
| Organism group | Relationship to birds | Approximate divergence | DNA similarity rank (non-bird) |
|---|---|---|---|
| Crocodilians | Sister group within Archosauria | ~250 million years ago | 1st (closest) |
| Turtles | Sister to Archosauria | ~255 million years ago | 2nd |
| Lizards and snakes | More distantly related reptiles | ~280+ million years ago | 3rd |
| Mammals | Amniotes but on a separate branch | ~320+ million years ago | 4th (most distant of amniotes) |
How mammals compare and why they're more distant
Mammals share the amniote lineage with birds, meaning both groups evolved from a common ancestor that could lay eggs on land. But the mammal and reptile-bird branches split very early, around 320 million years ago, which is a long time for DNA differences to accumulate. By the time you compare a bird genome to a mammal genome, you're looking at a much larger phylogenetic gap than the bird-crocodilian comparison.
Within mammals, humans are often used as a reference simply because the human genome is the most thoroughly annotated. If you ran a similarity comparison between a chicken and a human, you'd find that a large portion of protein-coding genes are still recognizably orthologous because those genes do fundamental cellular jobs that haven't changed much. But the overall genome-wide similarity, including intergenic regions, is substantially lower than between birds and crocodilians. The shared features you do find reflect deep, ancient function, not recent common ancestry.
Warm-bloodedness (endothermy) is a feature birds and mammals share, but it evolved independently in both lineages. It doesn't mean birds and mammals are more closely related; it's a case of convergent evolution. DNA doesn't care what an animal looks or behaves like, it just tracks descent.
Common misconceptions and how to interpret similarity measures
The biggest misconception I keep running into is the idea that birds are dinosaurs in a DNA-comparison sense, and therefore a bird's DNA should be most similar to, say, a Tyrannosaurus rex. So, is the bird theory accurate, and what does DNA-based similarity actually mean in practice? Birds did evolve from theropod dinosaurs, and they are technically avian dinosaurs. But non-avian dinosaurs are extinct. You cannot compare living bird DNA to T. rex DNA in any practical way because we don't have usable T. rex genome sequences, only fragmentary ancient protein data. The living organisms most similar to birds are the ones described above.
Another common error is equating visual similarity with genetic similarity. A bat looks more like a bird than a crocodile does, but bat DNA is far more distant from bird DNA than crocodilian DNA is. Evolution doesn't redesign the genome to match the body plan; it accumulates changes over time from a common ancestor outward.
People also sometimes confuse "percent identity" in a raw BLAST search with true evolutionary distance. If you paste a bird gene sequence into NCBI BLAST without filtering for orthologues first, you might get a high-scoring hit to a mammalian paralogue (a related but different gene) rather than the true orthologue. That result would be misleading. Proper similarity comparisons always filter for orthologous gene pairs before calculating percent identity, and tools like Ensembl Compara and OrthoDB do this automatically.
- Visual resemblance does not predict DNA similarity.
- Extinct relatives (non-avian dinosaurs) cannot be compared directly to living birds using DNA.
- Raw BLAST percent identity without orthology filtering can mislead.
- Mitochondrial DNA and nuclear DNA can give different signals; genome-scale nuclear data is more reliable for deep comparisons.
- Convergent traits like warm-bloodedness do not mean birds and mammals are close relatives.
How to check genetic similarity today

If you want to verify any of this yourself rather than take anyone's word for it, there are several free, accessible tools you can use right now. If you want to apply the bird DNA idea, start by using gene-sequence tools to calculate similarity and check orthologues, like the workflow above DNA testing for birds. The general workflow is: find a reference genome, identify orthologous genes, compare those genes across species, and interpret the percent identity or phylogenetic distance.
- Start with NCBI RefSeq (ncbi.nlm.nih.gov/refseq). RefSeq is a curated, non-redundant set of reference genomes, meaning you're working with clean, verified sequences rather than messy raw sequencing data. Search for your bird species of interest and download or view its genome record.
- Use NCBI BLAST (blast.ncbi.nlm.nih.gov) to search a bird gene sequence against the RefSeq database. Filter results to specific organism groups (e.g., reptiles vs mammals) to compare hit quality across groups. Focus on E-value and percent identity for orthologous hits.
- Use Ensembl (ensembl.org) for orthology-based comparisons. Find your bird species, open any gene page, and click the "Orthologues" tab. Ensembl Compara will show you percent identity and whole-genome alignment coverage for that gene across dozens of species, with quality scores to tell you how confident the orthology call is.
- Use OrthoDB (orthodb.org) to look up orthologous gene groups across vertebrates. Search a gene name, select the bird-level or vertebrate-level cluster, and see which species share orthologues and how they cluster.
- To check genome assembly quality before trusting a comparison, look for BUSCO scores in the genome's annotation report. A high BUSCO completeness score means the assembly is capturing most expected conserved genes, so missing data isn't being mistaken for divergence.
- For a published evolutionary tree you can consult directly, the Jarvis et al. 2014 bird phylogenomics study (available free on PubMed Central) provides genome-scale relationships for 48 bird species. The 2024 Nature study on family-level bird genomes extends this further and is the most up-to-date large-scale resource.
A quick practical test: go to Ensembl, find the chicken (Gallus gallus) gene for hemoglobin beta, and look at its orthologue table. You'll see that the closest matches by percent identity are other birds, then crocodilians, then turtles, then other reptiles, then mammals. That ordering reflects exactly the evolutionary history described in this article, and you'll have verified it yourself from primary genomic data rather than from anyone's summary.
If you're curious about how DNA testing for birds works in practice, such as for species identification or sex determination, the same databases underpin those workflows too. If you're trying to figure out how to do a bird DNA test for species identification or sex determination, start by using the same orthologue and genome-comparison workflow described here DNA testing for birds.
And if questions like this have you thinking about bird biology more broadly, the relationship between birds and their evolutionary relatives touches almost every aspect of avian anatomy and physiology, from their hollow bones (inherited from archosaur ancestors) to their unique respiratory system. Understanding what is the need for bird study also helps explain why questions about evolution matter for ecology, conservation, and behavior bird biology more broadly.
Soil can also matter for birds, because what birds eat and how they build nests can be influenced by local soil conditions and the insects or plants that depend on them hollow bones. Birds of prey still rely on photosynthesis indirectly, because the plants they eat support the entire food web that fuels their prey avian anatomy and physiology.
If your question is about bird anatomy, you may also wonder where the crop is located and how it works in the digestive system bird biology.
FAQ
Does the answer change if I compare mitochondrial DNA instead of nuclear DNA?
If you use mitochondrial DNA (mtDNA), the closest match can shift because mtDNA mutates much faster and may reflect different lineage-splitting timelines. For most “which organism is closest” questions at the level of major evolutionary relationships, nuclear DNA comparisons are more stable and are what large genome-scale studies tend to rely on.
What if I only compare one gene from a bird, will I still get the same closest organism?
Not necessarily. “DNA most similar” typically refers to shared ancestry measured across many orthologous genes and, ideally, genome-wide regions. If you compare only one or a few genes, those genes may have different evolutionary rates or could have been affected by lineage-specific duplication, producing a misleading “closest” organism.
Is “most similar” based on percent identity, and does percent identity always give the right evolutionary ranking?
It can also change depending on which DNA you measure, how you define similarity, and which regions you include. Intergenic and regulatory DNA evolve differently from protein-coding genes, so genome-wide similarity can produce a different ranking than coding-only percent identity.
Can I test DNA similarity to extinct relatives like non-avian dinosaurs?
Between living organisms, the practical closest matches to birds are the ones with available genome sequences. Even if a closer extinct relative existed, you cannot reliably compare to it unless there is usable ancient genetic material, which is uncommon for something like a non-avian dinosaur.
How do genome quality and assembly issues affect which organism appears closest?
Genomes are not uniformly assembled. If one species has a fragmented or lower-quality genome assembly, orthologue identification can fail or percent identity can be biased, sometimes making that organism look artificially closer or farther. Using studies that report quality control and replication across many loci reduces this risk.
How do I avoid the common mistake of comparing paralogues instead of orthologues?
You can avoid this by filtering for orthologues first, and then comparing the orthologue sets across species. A quick practical check is to use an orthologue browser or orthologue database output, then compute similarity from those gene pairs rather than running raw sequence similarity searches.
Why might a faraway species still show high similarity for a few bird genes?
Some pairs that are “distant” overall can still show high similarity for specific conserved genes involved in core cell functions. That means a high similarity score for one gene does not imply that the whole organism is closely related to birds.
If my question is about a specific bird species, how do I determine its closest DNA relatives?
For any bird species, the closest DNA match among non-birds will generally be crocodilians, while within birds the closest match will be its nearest relative in the bird family tree. If you tell me the exact bird species, I can help you interpret which other bird lineages would be expected to be closest.
What analysis choices most often change the result when researchers compute genetic relatedness?
Some comparisons can be skewed by sampling and model choices. For example, using a single locus, or using a distance model that ignores rate variation, can alter the inferred closeness. More reliable phylogenomic approaches use many loci and models that accommodate different evolutionary rates across genes.
Next Article
How Much Weight Can a Bird Carry Payload Limits Explained
Realistic payload ranges for different birds plus a method to estimate how much weight they can carry safely.